

Strong Towns Langley has identified significant concerns with the Township of Langley's approach to municipal finance and development strategy. What began as typical suburban sprawl issues, primarily single-family housing developments that generate insufficient tax revenue to cover their long-term infrastructure costs, has evolved into a pattern of increasingly risky financial strategies.
Our analysis reveals how the Township has employed several distinct approaches to address mounting financial and infrastructural deficits, each creating new challenges while attempting to solve previous ones. This cycle of financial dependency on growth raises important questions about long-term sustainability and fiscal responsibility.
This examination covers four distinct periods in our community's development history, showing how each financial strategy has led to the next. The Draft 2026-2030 Financial Plan reveals a municipality with borrowing capacity nearly exhausted, reserves being redirected from their intended purposes, and structural cost growth outpacing revenue.
Comprehensive Analysis
Is my town trapped in a Growth Ponzi Scheme?
This comprehensive analysis examines how Township of Langley's development patterns have evolved from the 1980s through today's debt-financed infrastructure approach.
Phase 1: The 1980s Walnut Grove Experience
Learning the costs of infrastructure during economic downturns
The Township's transformation into a suburban community accelerated with the development of Walnut Grove and Murrayville in the early 1980s. This period established financial patterns that would influence municipal strategy for decades to come.
The 1982 Recession Impact
Just as Walnut Grove development was underway, the early 1980s recession hit. With interest rates spiking and development slowing, the municipality found itself carrying infrastructure costs for serviced but undeveloped lots.
The 1982 Municipal Stewardship Report documented this challenge:
"We have a substantial number of serviced lots available in Langley Municipality, particularly in the Walnut Grove area."

Historical Documentation
1982 Municipal Stewardship Report documenting infrastructure challenges during the recession. Click to view full report.
Long-term Implications
This experience of carrying infrastructure costs during economic downturns would later influence how the Township approached development financing. As Frances Bula documented in her analysis of Fraser Valley growth patterns, the municipality cited this incident as a reason for rejecting front-loading infrastructure investments, as "[financing] those up front [...] would be hard on local taxpayers".
However some argue this incident has been somewhat overblown, as Kurt Alberts, who served in the Township's planning department from the early 1980s to the mid 1990s, explained to Strong Towns Langley via email:
"I don’t believe the story regarding Township bankruptcy [paying for the infrastructure like roads/sidewalks/lights/water/sewer in Walnut Grove] has any credibility [...] For the most part infrastructure was a requirement of the developer(s) of each subsequent Neighbourhood."
But the impact to individual developers was significant:
"The recession that came in 1981 left whole subdivisions within Neighbourhood 2 fully serviced with no purchasers. Prior to the recession new vacant lots were selling for up to $70,000. The bottom literally fell out of the market and I'm sure many developers went bankrupt during that time. When new lots again finally came on the market a few years later, $69,000 got you a lot and a house."
Phase 2: "Grow Faster" - The Willoughby Strategy
2000s-2010s: Subsidizing development to accelerate growth
As infrastructure in older areas like Walnut Grove began reaching end-of-life in the 2000s, the Township adopted what Strong Towns founder Chuck Marohn identifies as a common municipal response to financial pressure.
The Municipal Response to Financial Pressure
Chuck Marohn, from his experience consulting with cities across North America, explains what he observed as the typical first response when municipalities face financial difficulties:
Development Results (2001-2016)
- 800 new single-family homes
- 10,000 ground-oriented units
- 2,000+ new apartments
The Development Fee Freeze Strategy (2007-2019)
To accelerate growth in Willoughby and Yorkson, development fees were frozen for 12 years. This strategy successfully achieved several objectives:
Achieved Goals
- Rapid development in Willoughby/Yorkson
- Increased property tax revenues
- Attracted developers with low fees
- Created denser, more urban communities
Trade-offs
- Infrastructure gaps (incomplete 208 Street)
- Missing sidewalks and arterial connections
- Minimal community facilities
- Deferred infrastructure maintenance
Development Cost Charge History (1991-2024)
How the fee freeze strategy supported rapid Willoughby development
DCC Components
Phase 3: The Debt-Financed Approach
2020s: Addressing infrastructure deficits through borrowing and record-high fees
Following the 2022 municipal election, a new council faced pressure to address infrastructure deficits in Willoughby while pursuing additional community priorities. This led to a strategy combining record-high development fees with significant borrowing.
The New Financial Model
The current approach represents a significant shift from the previous fee-freeze strategy:
Increased Revenue
- Development Fees: ~$42k (2021) to ~$73.5k per unit (2024)
- Community Amenity Contributions: Added in 2018
- Expanded Scope: Beyond basic infrastructure
Debt Financing
- Authorized Debt: $168M to $668M
- Major Projects: Smith Athletic Park ($154.7M)
- Infrastructure: Road widening, facilities
A key assumption of this model is that development fees, particularly Community Amenity Contributions, would repay the debt incurred for capital projects. The Township proceeded with major projects like Smith Athletic Park and the LEC Ice and Dry Arenas on this basis, accumulating approximately $144 million in project debt to be repaid through future CAC collections.
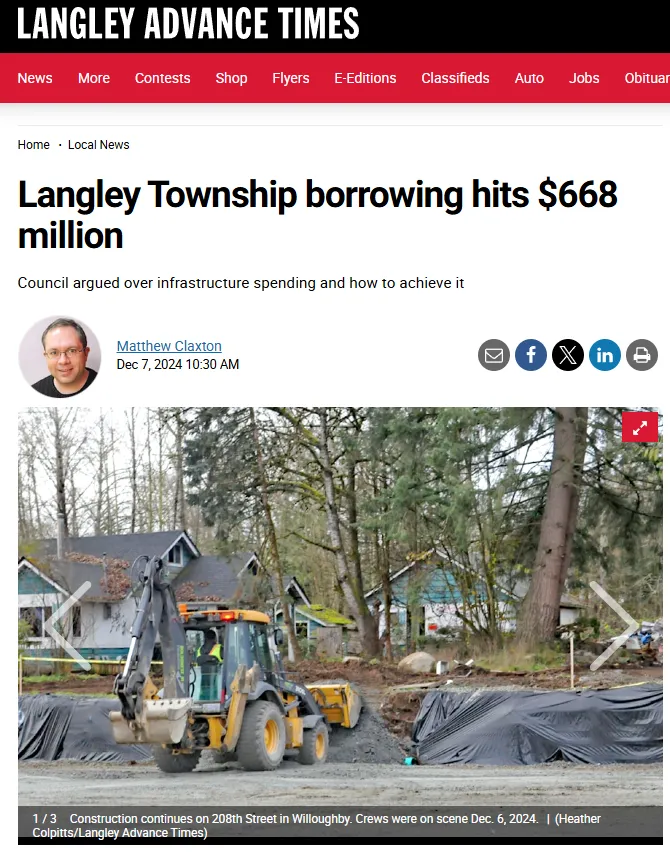
Media Coverage
Growing attention to unprecedented debt levels and financial strategy changes.
Legal Development
Supreme Court ruling on Community Amenity Contributions creates revenue uncertainty for the current financial model.
Understanding Community Amenity Contributions
CACs are a tool used by municipalities across BC to fund amenities (libraries, recreation centres, parks, childcare) that cannot be funded through Development Cost Charges. When land is rezoned to a higher density, its market value typically increases. CACs capture a portion of this "land lift" for community benefit.
Why Developers Generally Accept CACs
- Mutual benefit: Amenities like parks and community centres make an area more attractive to buyers and tenants, directly supporting marketability
- Level playing field: All developers contribute proportionally, so no one benefits from publicly funded amenities without contributing
- Practical relationships: Rezoning decisions are discretionary, and contributing to community needs is part of productive municipal relationships
The Legal Grey Area
- No explicit statutory authority: CACs are not legislated in BC. Section 931(6) of the Local Government Act prohibits fees or charges unless authorized by statute (Provincial guide)
- Must be voluntary: A municipality cannot legally require CAC payment as a condition of rezoning
- Debated legality: Municipal lawyer Gregg Cockrill of Young Anderson argued in a detailed 2019 paper that CACs are likely lawful when designed to offset zoning-change burdens or capture a share of the benefit
This system works when CAC rates still allow projects to be financially viable. In the Township's case, a June 2024 amendment added a $550,000/acre target contribution for the Williams and Smith Neighbourhood Plan areas. The plaintiff developer, Lorval Developments, estimated this added $32 to $39 million in new costs to its project. It was this rapid escalation, rather than the principle of CACs themselves, that prompted the legal challenge.
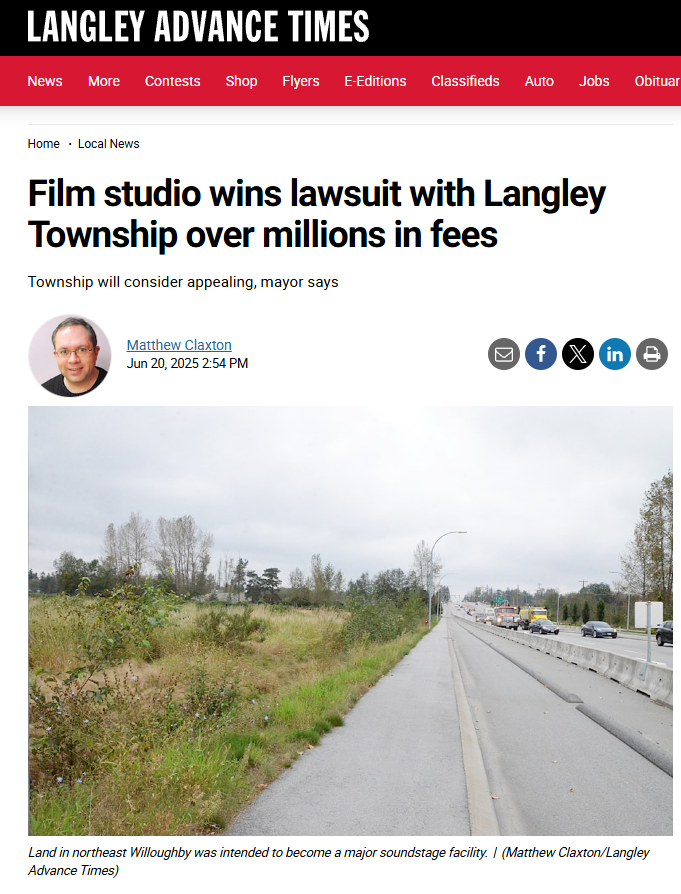
The Court Ruling and Its Aftermath
In June 2025, the BC Supreme Court ruled the Township's CAC policy "invalid," finding it was "a mandatory amenity payment regime beyond Langley's legal authority" (para. 134) (Lorval Developments Ltd. v. Langley (Township), 2025 BCSC 1148). This struck at the revenue source the Township was relying on to repay $144 million in project debt. The projects were already built or under construction, but the legal basis for collecting the fees to repay them had been invalidated.
Two replacement options were available:
Amenity Cost Charges (ACCs)
The Province's legislated response to CAC legal uncertainty (Bill 46). Unlike CACs, ACCs can be mandatory, with bylaw requirements and provincial oversight.
Key constraint: ACC revenue cannot repay debt on projects under construction prior to bylaw adoption. This means $144 million in existing project debt cannot be repaid using ACC funds. The draft ACC Bylaw was revised in December 2025 to remove borrowed funds, acknowledging this.
See our analysis: The CAC Risk in the Township of Langley's Financial Strategy.
Voluntary CACs (Interim Policy)
The Township adopted an interim voluntary CAC policy allowing case-by-case negotiation or amenity contributions at the initiative of applicants. No legal mechanism exists to require a specific amount.
Revenue at risk: The Township estimates ~$165 million in potential CAC revenue from ~50 in-stream projects. However, in at least one case (a proposed 39-storey tower), the developer offered approximately half the amount calculated under the previous mandatory policy.
The ACC Bylaw Postponement
At the January 26, 2026 Council meeting, the Amenity Cost Charges Bylaw (item H.1) was postponed. ACCs, while unable to repay existing debt, would provide a legally enforceable mechanism for future development contributions. By postponing, the Township remains reliant on voluntary CAC negotiations as its primary collection tool, including for repaying the $144 million in existing project debt.
Economic Context
The strategy assumes continued growth to service debt obligations. However, broader economic factors may affect this assumption, including significantly reduced Canadian population growth which could lead to reduced housing demand.
Phase 4: The Fiscal Constraints Emerge
2026: Borrowing capacity constrained, reserves redirected, costs deferred
The Draft 2026-2030 Financial Plan, presented to Council on February 23, 2026, shows a municipality that has used most of the financial tools available to manage the current budget cycle. While the headline property tax increase of 3.98% appears modest, the five-year projections and underlying financial manoeuvres reveal significant structural pressures.
From 18.24% to 3.98%: How the Reduction Was Achieved
The 2025 budget projected an 18.24% property tax increase for 2026. The actual draft came in at 3.98%. How was this accomplished?
Using Reserves for Internal Borrowing and Capital Debt Servicing
MFA Borrowing Maxed Out
The statutory borrowing ceiling is ~86% consumed, partly due to the Housing Trust's ~$180M in debt (detailed below). Only ~$11M/yr of MFA debt servicing room remains.
$79M in Capital Costs Due
The Smith Athletic Park and Ice and Dry Arena projects are already under construction. The $79M bill cannot go through the MFA without consuming nearly half the remaining ceiling.
Internal Borrowing Used
$79M borrowed from three purpose-specific reserves (parkland, sewer, equipment) at 4.69% over 30 years. Bypasses the MFA ceiling entirely. This avoids these bills being due immediately via a property tax increase, at the expense of drawing down reserves.
If $79M Had Gone Through MFA
With Internal Borrowing (Actual)
$10.1M in Debt Servicing Covered by Reserves (One Year Only)
Separately, $10,121,286 in "Capital Debt Servicing" was classified as a one-time item funded from reserves (E.5 Page 6). The budget does not specify which reserve or which capital debts this covers. Because one-time items funded from reserves have no impact on the tax rate, this removed roughly 5.3 percentage points from the 2026 headline.
This coverage expires in 2027. The "Transfer from Own Funds" line drops from $15.9M in 2026 to $5.5M in 2027, a gap of $10.4M that must be replaced by property taxes. This is a major driver of the projected 22.80% increase for 2027.
2026: Reserve Transfers In
2027: One-Time Coverage Expires
Borrowing for routine maintence
Three borrowing bylaws for routine maintanence were passed - these move expected maintence costs, typically taken from the operating budget, into debt servicing. This defers the immediate tax impact and highlights a lack of capacity to cover these costs from ordinary reserves.
| Borrowing Bylaw | Description | Month | Amount |
|---|---|---|---|
| 6084 | Road Replacement | May-26 | $6,959,596 |
| 6110 | Culvert Replacement | May-26 | $12,818,182 |
| 6127 | Roof Replacement | May-26 | $9,858,586 |
| $29,636,364 | |||
| 2026 Total Property Taxes (actual) | $192,027,242 | ||
| 2026 Total Property Taxes (If this maintanence was paid upfront instead of borrowed) | $221,663,606 | ||
| Effective Tax Increase | 20% | ||
Other mechanisms
- $7.3 million in other one-time items funded from prior year surplus and reserves (election costs, contingencies, LED displays, critical road reconstruction, studies)
- $1.425 million reduction in the transfer to the capital projects reserve
- $1.25 million in operating efficiencies, the only permanent structural savings
Comparing the five-year projections from both budget documents shows that the cumulative totals are nearly identical. The year-by-year distribution shifted, but the overall magnitude did not:
| Budget Document | 2025 | 2026 | 2027 | 2028 | 2029 | 2030 | Cumulative |
|---|---|---|---|---|---|---|---|
| 2025 Budget projections | 4.50% | 18.24% | 8.16% | 5.94% | 4.83% | - | ~41.7% |
| 2026 Draft projections | - | 3.98% | 22.80% | 4.79% | 4.21% | 4.43% | ~40.2% |
Internal Borrowing from Reserves
The Draft 2026-2030 Financial Plan includes a recommendation for Council to authorize the following (February 23, 2026 Council Meeting Agenda):
"That Council direct staff to fund $15,660,000 from the CAC Reserve and to internally borrow $52,200,000 from the Neighbourhood Parkland Reserve, $25,000,000 from the Sewer Capital Works Reserve and $1,850,000 from the Public Works Equipment Replacement reserve for the outstanding project funding required for the Smith Athletic Park and the Ice and Dry Arenas Projects to be repaid by CAC and/or General Revenue within a maximum of 30 years at an interest rate of 4.69%."
As outlined above, internal borrowing does not count against the statutory Liability Servicing Limit, which is why this approach was used. In practice, it transfers funds from one municipal reserve account to another, allowing money collected for a specific purpose to be used for an unrelated one. The reserves being borrowed from were established and funded for entirely different purposes than the Smith Athletic Park and arena projects:
$52.2M
Neighbourhood Parkland ReserveIntended purpose: Acquisition of parkland to serve growing neighbourhoods.
Being used for: Smith Athletic Park and LEC Ice and Dry Arenas construction. Repayable over 30 years at 4.69%.
$25.0M
Sewer Capital Works ReserveIntended purpose: Replacement and improvement of sewer infrastructure, funded by sewer utility ratepayer fees.
Being used for: Smith Athletic Park and LEC Ice and Dry Arenas construction. Sewer rates increased 28.69% in 2025.
$1.85M
Public Works Equipment ReserveIntended purpose: Replacement of public works vehicles and heavy equipment.
Being used for: Smith Athletic Park and LEC Ice and Dry Arenas construction. Repayable over 30 years at 4.69%.
The repayment terms are 30 years at 4.69% interest, funded by Community Amenity Contributions (CACs) and/or general revenue. It is worth noting that the June 2025 BC Supreme Court ruling found the Township's CAC policy invalid, though an interim policy is in effect. While the Township is transitioning to provincial Amenity Cost Charges, the replacement revenue timeline and amounts are not yet confirmed, and CACs are also the identified repayment source for this internal borrowing.
The Borrowing Ceiling: Liability Servicing Limit
Under Section 174 of the BC Community Charter, a municipality's total annual debt servicing costs cannot exceed 25% of its revenue. For the Township, this sets a ceiling of approximately $79.1 million per year in debt servicing, based on $316.5 million in revenue.
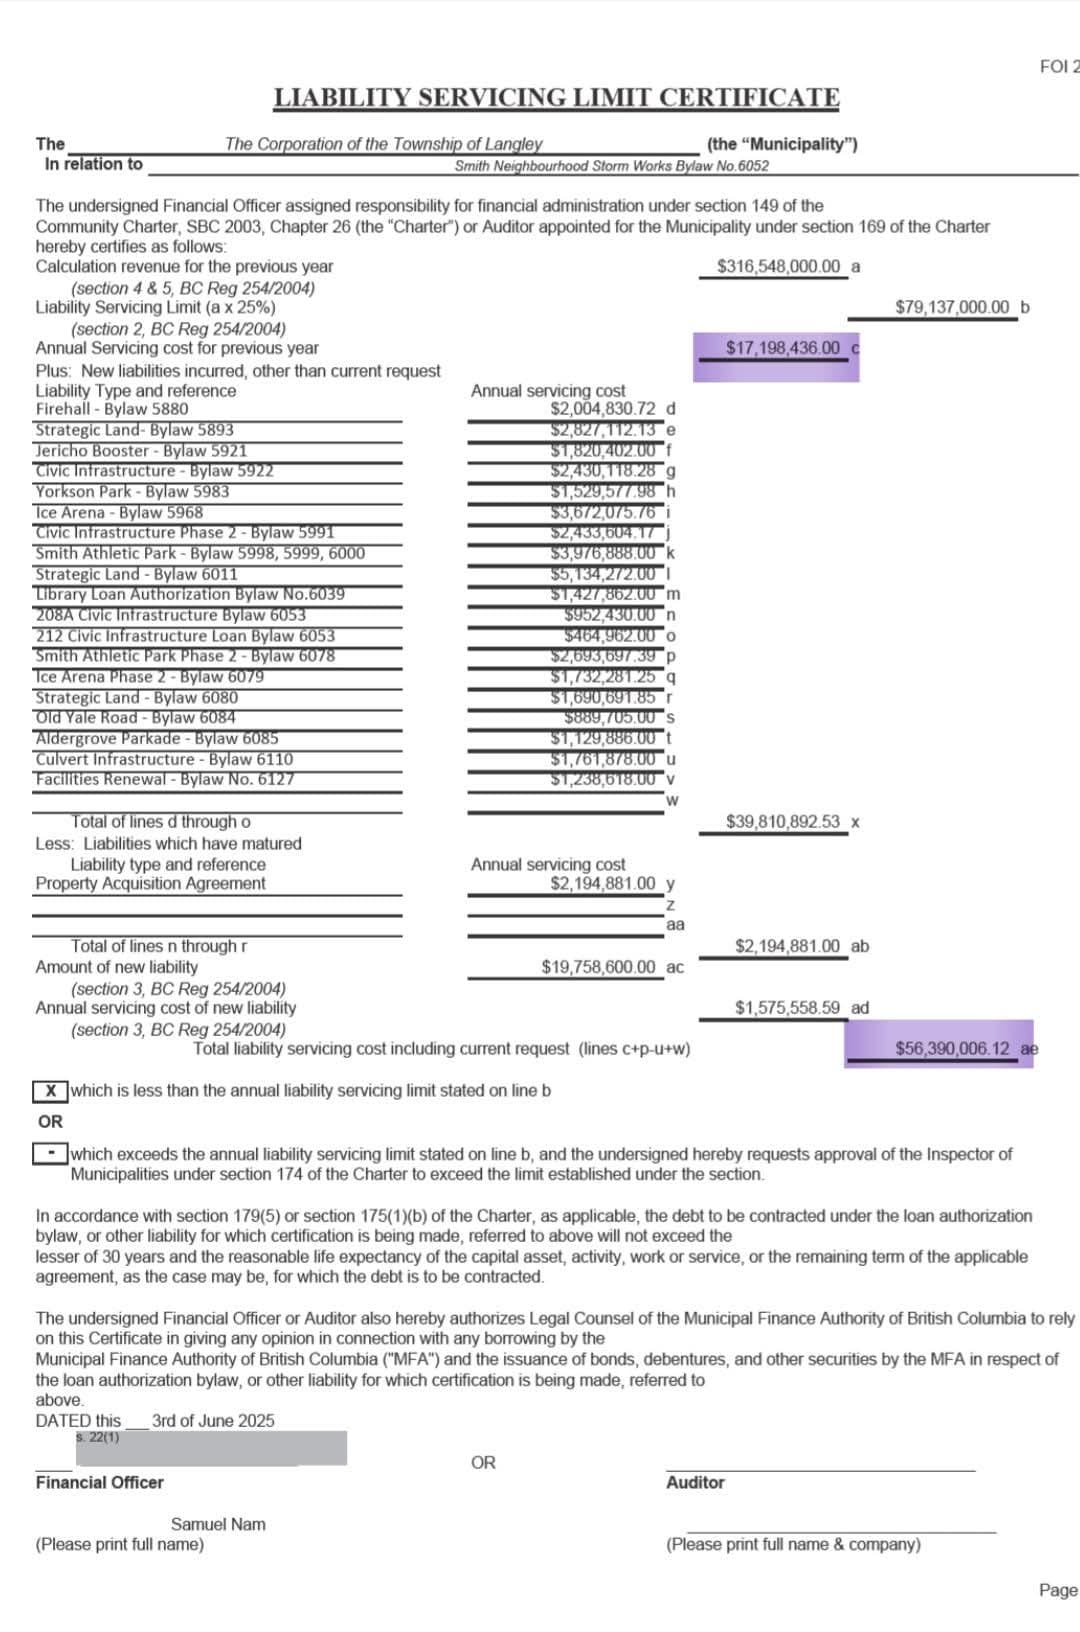
Liability Servicing Limit Certificate
June 2025 certificate showing total liability servicing cost of $56.4M against a $79.1M annual limit, leaving approximately $22.7M in borrowing room before Housing Trust debt was included.
Source: FOI request
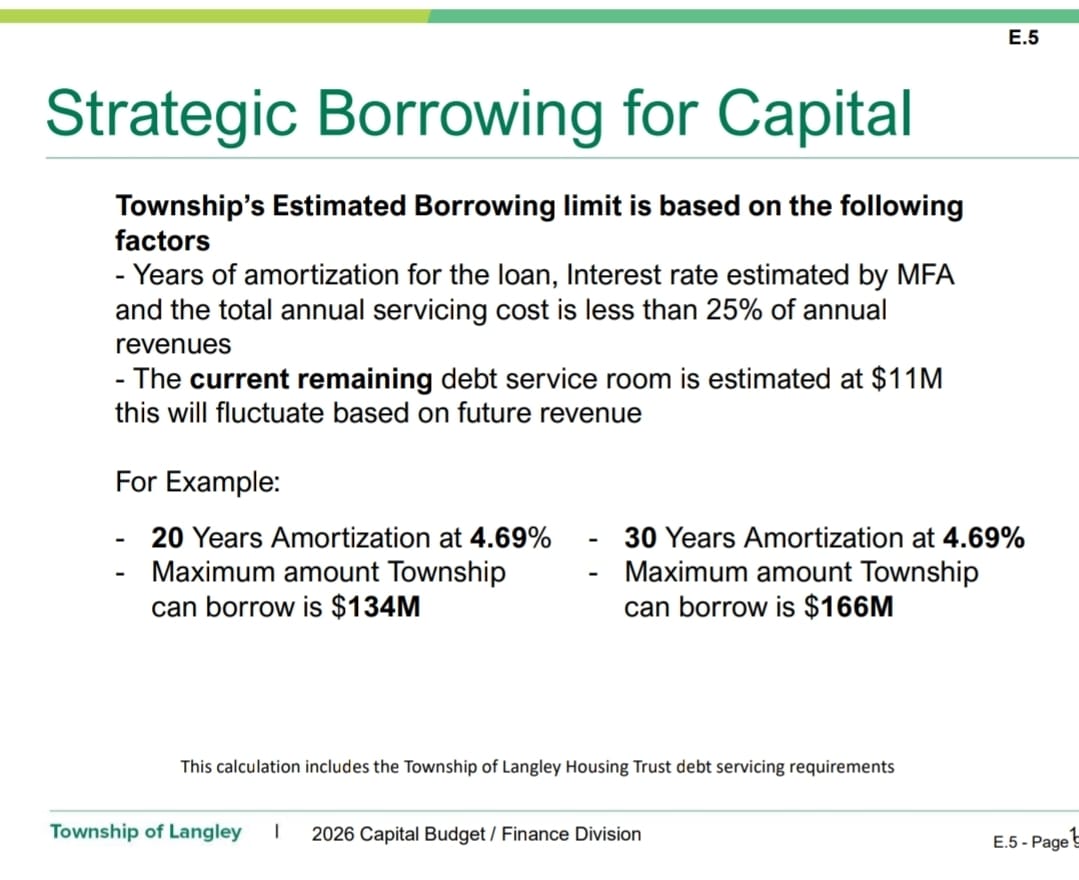
Strategic Borrowing for Capital
2026 Capital Budget slide showing remaining debt service room of $11M, noting that "this calculation includes the Township of Langley Housing Trust debt servicing requirements."
Source: Draft 2026-2030 Capital and Universal Operating Financial Plan
The Housing Trust Impact
A major factor in the reduction of available borrowing room is the Township of Langley Housing Trust Society. Originally presented as "debt-neutral," the Housing Trust carries approximately $180 million in debt. When its servicing obligations were included in the Liability Servicing Limit calculation, the Township's available borrowing room dropped from approximately $22.7 million to $11 million, a reduction of more than half, without a single new borrowing bylaw being passed.
The 2026 Capital Budget formalizes the Housing Trust as a capital project with $177,276,072 funded entirely through debt. This is the first time the full obligation has appeared as a line item in the Township's capital plan.
The Housing Trust's initial projects include nearly 250 rental homes across two sites in Willoughby and Aldergrove, developed in partnership with BC Housing through the BC Builds program. The plan is for 70% of homes to be offered at market rates and the remaining 30% at 20% below market rent.
While the Housing Trust will generate rental income, no public financial plan has been released showing how that revenue compares to the annual debt servicing costs. The LSL formula (Section 174 of the Community Charter) allows revenue to offset the debt servicing impact, but only indirectly: the limit is calculated as 25% of total municipal revenue, so Housing Trust rental income would need to flow through as Township revenue to expand the ceiling. Even then, because the limit is 25% of revenue, every $1 of rental revenue only creates $0.25 of additional servicing room. To fully offset the approximately $11.6M in servicing capacity consumed by the Housing Trust, the Trust would need to generate roughly $46M in annual revenue attributable to the Township, a figure far exceeding what 246 rental units could produce.
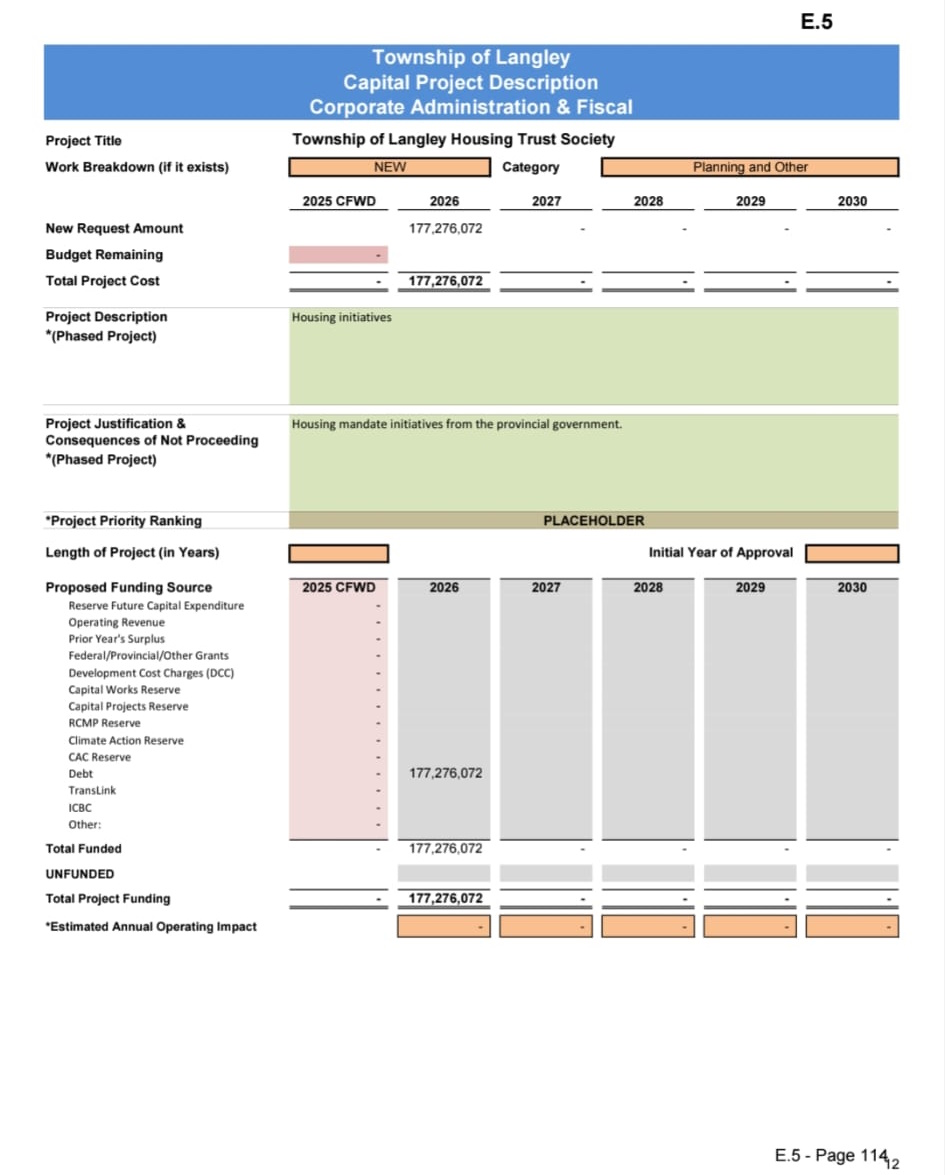
Housing Trust Capital Project
The 2026 Capital Budget includes the Housing Trust as a new capital project with $177.3M funded entirely through debt.
Source: Draft 2026-2030 Capital and Universal Operating Financial Plan, E.5 Page 114
Borrowing Room: Before Housing Trust
Borrowing Room: After Housing Trust
Structural Cost Growth
Beyond the capital financing constraints, the operating budget reveals structural cost pressures growing faster than the revenue base:
Protective Services (77% of 2026 increase)
RCMP contract costs increase $2-2.5M annually, largely outside municipal control. The plan adds 2 officers in 2026, 3 in 2027, and 2 in 2028. Fire services are adding 16 firefighters in 2026 alone, with 6 more planned for 2027.
Debt Servicing
Debt principal and interest payments climb from approximately $33M in 2025 to $47.7M in 2026 and are projected to reach $64.2M by 2030. This does not include internal borrowing repayments.
New Facility Operating Costs
The LEC Ice and Dry Arenas (opening August 2026) add $1.166M in operating costs for five months. Fire Hall #5 adds another $109K. These costs grow in 2027 as full-year impacts are realized.
Utility Rate Pressures
Sewer rates increased 28.69% in 2025 (62% driven by Metro Vancouver's North Shore Wastewater Treatment Plant). Regional sewerage charges are projected to climb 5-9% annually through 2029.
Sources
All figures on this page are drawn from the Draft 2026-2030 Capital and Universal Operating Financial Plan, the 2025 Budget and Operating Plan, the Township of Langley 2024 and 2023 Annual Reports (Financial Sections), and the June 2025 Liability Servicing Limit Certificate obtained via FOI. The borrowing bylaw and "Apples to Apples" effective tax increase analysis was contributed by Mike Parker.
Municipal Finance History (2007-2024)
Revenue, debt, and development contributions through all four phases
Financial Indicators
Current Context and Financial Sustainability
Converging Risks
The Phase 4 analysis reveals that the Township's financial strategy now faces multiple simultaneous constraints. The assumptions underlying the debt-financed approach in Phase 3 are being tested:
Borrowing Capacity Constrained
Approximately 86% of the statutory borrowing limit is consumed, including Housing Trust obligations, leaving limited room for conventional municipal borrowing.
Reserves Committed
$79M internally borrowed from purpose-specific reserves. General Capital Reserve effectively empty ($189K). Debt Retirement Reserve drawn from $7.6M to $1.1M in a single year.
Legal Framework Uncertain
Court ruling on CACs creates revenue uncertainty; CACs are also the planned repayment mechanism for the $79M internal borrowing.
Structural Costs Accelerating
Debt servicing nearly doubling (from $33M to $64M by 2030), protective services consuming 77% of annual budget growth, and new facility operating costs compounding.
Growth Dependency Persists
Debt servicing and internal borrowing repayment depend on continued development activity, while national population growth has slowed and tariff uncertainty clouds the economic outlook.
Historical Pattern
Each phase has followed a consistent pattern: an initial strategy generates growth but creates new obligations, which are then addressed with increasingly aggressive financial tools, which in turn create further constraints.
The Cycle
- Phase 1: Infrastructure-first development during a downturn created fear of front-loading costs
- Phase 2: Fee freezes subsidized growth but created infrastructure deficits
- Phase 3: Record borrowing and high fees addressed deficits but created massive debt obligations
- Phase 4: Debt obligations and structural costs have consumed most of the statutory borrowing ceiling; the 2026 budget relies on one-time reserve-funded debt servicing coverage and cost reclassification to manage the current year's tax increase, while borrowing bylaws add a further $29.6M in committed obligations
The Core Question
Based on the Township's own five-year projections, the cost structure is growing faster than its revenue base. Each budget cycle has used more of the remaining financial flexibility to smooth the gap. With borrowing capacity at approximately 86%, major reserves lent out, and a 22.80% tax increase projected for 2027, the available tools for continued deferral appear limited. The Strong Towns framework identifies this as a common outcome of growth-dependent finance: the obligations of past growth consume the resources needed for future resilience.
Sustainable Development Alternatives
The Strong Towns methodology emphasizes building community wealth through incremental development that doesn't require municipal subsidies or create long-term financial obligations.
Incremental Development
Infill Development
Encourage density in existing neighborhoods with established infrastructure and proven demand.
Mixed-Use Zoning
Allow neighborhood businesses and diverse housing types to develop organically. Commercial pays higher property tax rates, improving financial performance in residential areas.
Adaptive Reuse
Maximize value from existing built environment and infrastructure investments.
Value-per-Acre Focus
Prioritize areas that generate sufficient tax revenue to sustain their infrastructure.
Financial Resilience
Infrastructure Optimization
Upgrade existing systems rather than building new ones that create additional maintenance obligations.
Lifecycle Cost Analysis
Full accounting for maintenance and replacement costs over infrastructure lifespan.
Diversified Revenue
Reduce dependence on development fees through sustainable tax base growth.
Phased Implementation
Match infrastructure investment timing to demonstrated demand and financial capacity.
Strong Towns Approach
This approach allows communities to grow organically based on market demand while maintaining financial resilience. Rather than requiring subsidies or creating long-term obligations, incremental development builds community wealth gradually and sustainably.
Resources and Further Analysis
Strong Towns Langley Analysis
The Minimum Densities of Willoughby
Jul 2024Exploring development fee policy and density requirements in Willoughby's development model.
Financially Sustainable Growth
Dec 2024Part 1: The Illusion of Wealth - examining current debt levels and growth dependency patterns.
The CAC Risk in the Township of Langley's Financial Strategy
Dec 2025How the CAC court ruling created a $144M debt gap and the challenges of replacing that revenue.
External Resources
Get Involved in Community Financial Planning
Informed Community Engagement
Understanding municipal finance helps residents make informed decisions about community development priorities and evaluate the long-term sustainability of growth strategies.
Public Participation
- Attend municipal council meetings
- Ask questions about long-term financial sustainability
- Review annual budgets and debt levels
- Examine infrastructure maintenance plans
Development Advocacy
- Consider financial implications of proposed projects
- Support zoning reforms for incremental improvement
- Advocate for value-per-acre analysis
- Promote financially sustainable development patterns
Financial Transparency
Join us in advocating for financially sustainable development that strengthens our community's long-term prosperity.
Stay Informed